Dvě tváře rozdělení akcií: Když změna ceny neznamená skutečnou hodnotu
Rozdělení akcií je častým nástrojem, jak firmám pomoci zatraktivnit své akcie drobným investorům. Ale jak ukazuje případ dvou zcela odlišných společností – O’Reilly Automotive (ORLY) a Regencell Bioscience Holdings (RGC) – kosmetická úprava ceny ještě neznamená investiční příležitost. Ba naopak: někdy může být jen závojem, který skrývá hlubší problémy.
Společnost O’Reilly Automotive je ukázkovým příkladem firmy, která rozdělením akcií ještě více zpřístupnila stabilní a rostoucí byznys. Tržní kapitalizace přes 76 miliard USD, solidní hrubá marže 51 %, absence dividendy, ale intenzivní zpětné odkupy – to vše svědčí o pečlivě řízené firmě s důrazem na efektivitu a ziskovost. O’Reilly čerpá z demografických i makroekonomických trendů: stárnoucí vozový park, vyšší náklady na nová auta, a tedy vyšší poptávka po náhradních dílech. Síť 31 distribučních center a 400 centrálních obchodů umožňuje flexibilitu a rychlost – konkurenční výhody, které se těžko kopírují. Dlouhodobý růst zisku na akcii díky masivním buybackům zvyšuje atraktivitu titulu pro investory s dlouhým horizontem.

Na opačné straně spektra stojí Regencell Bioscience (RGC) – společnost, která vzrostla o neuvěřitelných 60 100 % od začátku roku 2025, ale je příkladem extrémního spekulačního šílenství. Navzdory tržní kapitalizaci přes 38 miliard USD firma nemá žádný hotový produkt, nulové tržby, jen 12 zaměstnanců, z toho čtyři ve vývoji, a čelí riziku zániku kvůli nedostatku kapitálu. Rozdělení akcií v poměru 38:1 zde neznamenalo nic jiného než pokus o zvýšení likvidity a zájmu – což se podařilo, ale bez reálné opory ve fundamentu. Ztráta 4,3 milionu USD v roce 2024 a varování o schopnosti dále fungovat jsou jasnými signály, že Regencell je spíše horký brambor než investiční příležitost.
Zatímco u O’Reillyho má rozdělení akcií ekonomické opodstatnění – firmě se daří, je stabilní, roste zisk a reaguje na reálnou poptávku – u Regencellu jde čistě o psychologický efekt a krátkodobý růst podpořený iracionálním nadšením investorů. V takovém prostředí se stává, že investoři sledují výkonnost na grafu místo skutečných čísel ve výkazu zisku a ztrát. A to je cesta do pasti.
Rozdíl mezi těmito firmami ukazuje, že rozštěpení akcií samo o sobě není zárukou úspěchu. Klíčem zůstává dlouhodobý růstový příběh, transparentní řízení, konzistentní ziskovost a reálná poptávka po produktu či službě.

Regencell Bioscience tak svým růstem připomíná typický „meme stock“ – akcii, která láká pozornost investorů kvůli virálnímu šíření a extrémnímu pohybu ceny, nikoli kvůli reálné vnitřní hodnotě. Takové akcie mohou být z krátkodobého hlediska výnosné pro spekulanty, ale dlouhodobě pro běžné investory obvykle znamenají značné riziko. V případě Regencellu navíc neexistují žádné důkazy o tom, že by firma měla dostatečné kapacity, technologii nebo obchodní plán, který by ospravedlňoval miliardovou valuaci.
Pro srovnání, O’Reilly Automotive zůstává příkladem klidného a rozvážného růstu. Přesně takové firmy mají tendenci tvořit jádro portfolií dlouhodobých investorů. Její podnikání není sexy, ale je důvěryhodné a ziskové. Místo slibů do budoucna nabízí hmatatelné výsledky dnes. Pravidelné buybacky navíc dávají investorům přímý podíl na úspěchu společnosti, což v době vysoké volatility není maličkost.
Současné dění kolem rozdělení akcií jasně ukazuje, že investoři by měli rozlišovat mezi optikou a podstatou. Zatímco Regencell nabízí dramatické cenové skoky bez pevné základny, O’Reilly reprezentuje stabilitu podloženou konzistentním výkonem. A to je rozdíl, na který by měl každý investor brát zřetel.
Závěrem je třeba připomenout, že i na dnešním trhu, kde technologie a novinky vládnou titulkům, mají své místo firmy s osvědčeným modelem a realistickým růstem. Rozdělení akcií může být poutavý titulek, ale nikdy by nemělo být hlavním důvodem k nákupu. Klíčem je vždy fundamentální síla – a právě tu nabízí O’Reilly, zatímco Regencell naopak alarmuje.
The GBP/USD currency pair attempted to continue its decline from Friday to Monday, but nothing came of it. The local fundamental and macroeconomic backdrop remains favorable to the U.S. dollar, but it is not as strong as many might think. Recent macroeconomic data in the U.S. have indeed improved compared to 2025. Business activity is rising, and the labor market is recovering. Only the GDP growth rates and inflation are disappointing. However, an acceleration in inflation is also a positive signal for the American currency, as the Federal Reserve would then be more "hawkish." Thus, only the pace of economic growth raises concerns among traders at the moment.
Geopolitics remains consistently negative but is not worsening. Despite the ongoing shelling in the Middle East, a full-scale war is not resuming, and negotiations, after all, are still ongoing. Therefore, in our opinion, the dollar still lacks long-term prospects. At this point, it is essential to understand whether the market's reaction to Friday's Nonfarm Payrolls was a one-time event. In recent weeks, traders have ignored both the macroeconomic background and geopolitical factors. If the market enters the trading regime of the past few weeks, we can expect another flat and low volatility.
The British pound, like the euro, is currently in a black period. In 2026, almost everything is stacked against risk assets and currencies, so it is not surprising that they cannot sustain the upward trends seen in 2022 and 2025 for now. Nevertheless, this difficult phase will eventually end, and even the war in the Middle East will not last forever. We continue to believe that the conflict between Iran and the U.S., as well as their allies, will turn into a sluggish bickering with regular shelling and rocket strikes, but without full-scale military actions. In this case, the market is unlikely to buy dollars again solely for their "safe properties." Periodically, the U.S. dollar may appreciate, but we generally regard any increase in the dollar as a correction.
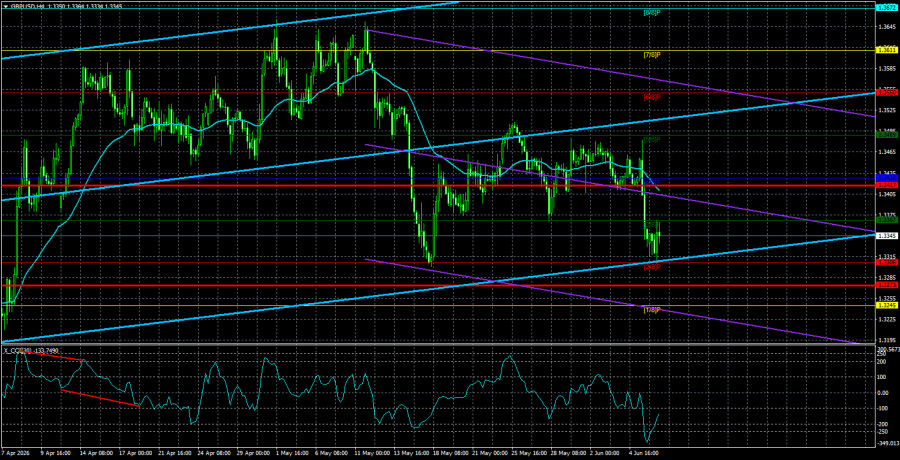
As for the British pound, it also has a few growth factors. The Bank of England is almost guaranteed to abandon further monetary policy tightening in June, and another political crisis in the UK does not make the pound more attractive to traders, as the British economy's growth rates have long been unsatisfactory. Nonetheless, the prospects for the British currency are somewhat better. Just looking at the daily timeframe makes it clear—the GBP/USD pair has been in sideways movement for nine months, and the dollar has not shown any stronger movement than a pullback or correction. This week, the American currency may receive some assistance from the inflation report due out on Wednesday, but it could equally support the British pound. On the 4-hour timeframe, the pair has not yet breached the 1.3306 level, so an upward pullback this week is quite possible.
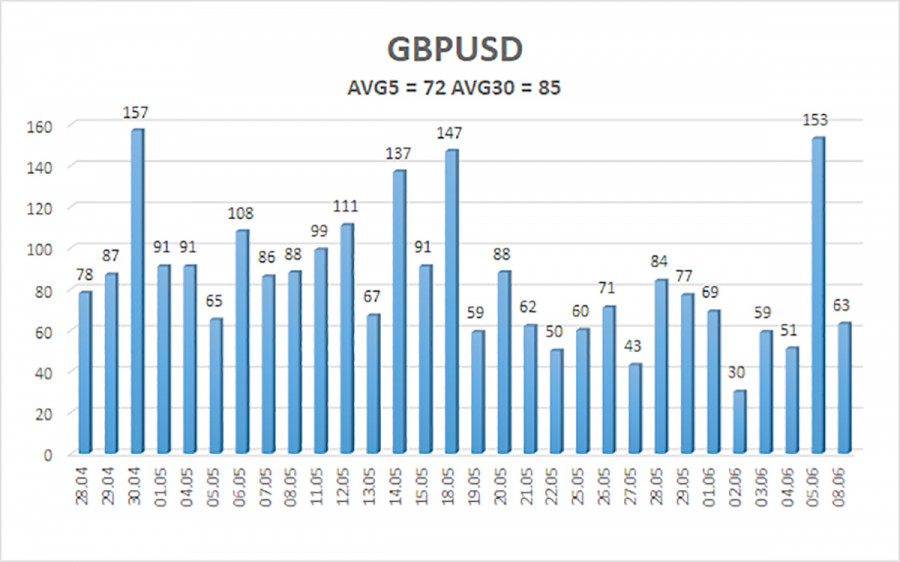
The average volatility of the GBP/USD pair over the last five trading days is 72 pips. For the pound/dollar pair, this value is considered "average." On Tuesday, June 9, we expect movement within a range bounded by levels 1.3273 and 1.3417. The upper channel of the linear regression is directed upward, indicating a recovery of the upward trend. The CCI indicator has entered oversold territory, signaling a possible end to the downward trend.
S1 – 1.3306
S2 – 1.3245
S3 – 1.3184
R1 – 1.3367
R2 – 1.3428
R3 – 1.3489
The GBP/USD currency pair has resumed its downward movement. Trump's policies will continue to put pressure on the U.S. economy, so we do not anticipate long-term growth in the U.S. dollar. However, 2026 is shaping up to be very positive for the dollar due to geopolitics. Therefore, long positions with targets at 1.3489 and 1.3550 may be considered when the price is above the moving average. If the price is below the moving average line, trading to the downside with targets at 1.3273 and 1.3245 will be appropriate. The market situation often changes, and it continues to primarily track geopolitical news, which is not homogeneous.
Linear regression channels help determine the current trend. If both are directed in the same direction, the trend is strong;
The moving average line (settings 20,0, smoothed) determines the short-term trend and the direction in which trading should be conducted;
Murray levels are target levels for movements and corrections;
Volatility levels (red lines) are the probable price channels within which the pair will stay for the next 24 hours, based on current volatility indicators;
The CCI indicator entering the oversold zone (below -250) or the overbought zone (above +250) indicates an approaching trend reversal in the opposite direction.

QUICK LINKS


 Contact Us