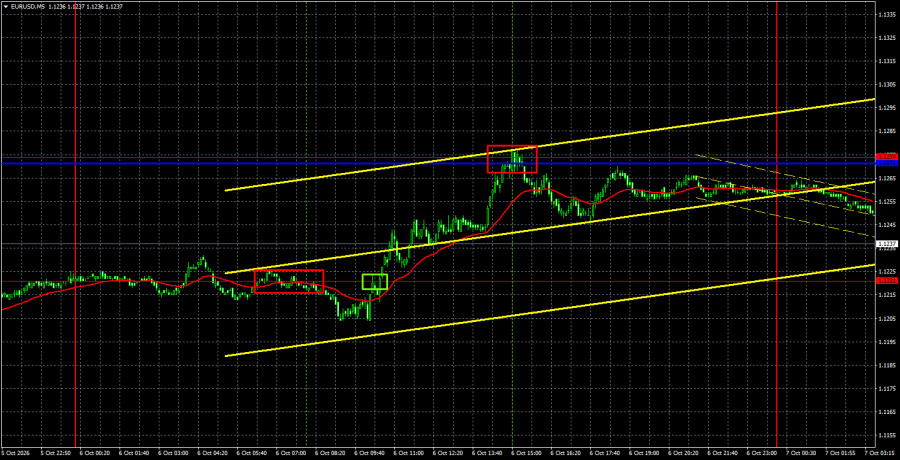
The EUR/USD pair showed a modest recovery on Tuesday, but that recovery looks convincing only on the very shortest timeframes. On the daily chart, it is barely visible — the euro remains at the very bottom on that timeframe, a bottom that can be pierced many times. Our view is unchanged: the month-long euro decline and dollar strength lack clear, coherent reasons. We observe an inertial, speculative move. Over the past month, EUR/USD has not produced a meaningful correction even once. Such long one-way stretches are rare on the daily chart, so the recent movement is clearly not driven by macro, geopolitical, or fundamental factors. On Monday, no major events or important releases justified the market moves; the euro's rise was therefore a trivial, minimal retracement. The pair's decline can easily resume today.
Technically, the downtrend formation continues. The market has been buying the dollar for the fourth consecutive week. The trendline remains relevant, price sits below the Ichimoku lines, and thus the pair's fall is fully consistent from a technical standpoint.
On the 5-minute TF on Tuesday, three fairly decent trading signals were generated. First, a false sell signal appeared near 1.1221, but the next buy signal around the same level was valid and allowed traders to open long positions that realized about 30–35 pips. A rejection from the 1.1271–1.1274 area allowed short positions to open, which remain relevant today.
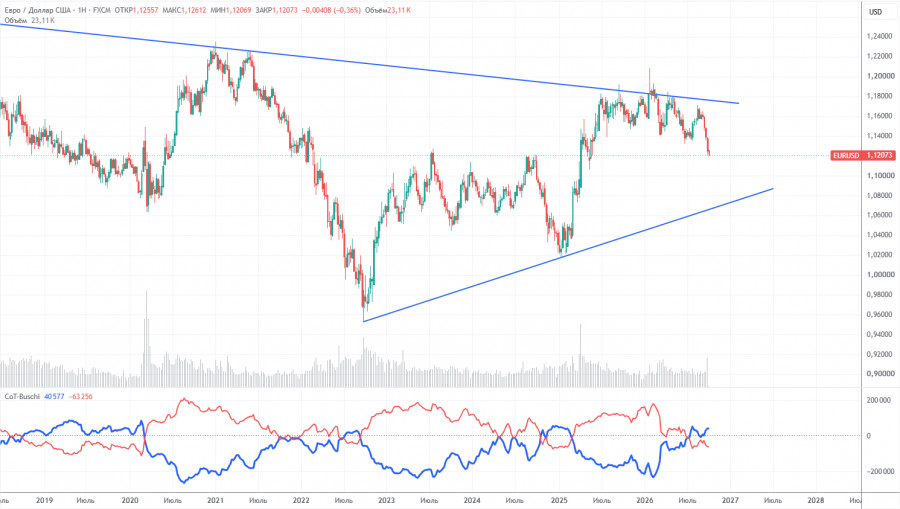
The latest COT report is dated September 29. On the weekly TF chart, non-commercial traders' net position remains "bearish" and fell significantly in 2026 due to geopolitical events. Traders have been shedding the euro in favor of the US dollar over the past six months. Donald Trump's policies have not changed, but the dollar has, for a time, acted as a "reserve currency."
However, we still do not see any fundamental factors for further strengthening of the US currency. The war in the Middle East made the dollar temporarily super-attractive, and the Federal Reserve's monetary stance surprised the dollar for the second time this year. In the long term, the euro could fall even to $1.08 (the trendline), but the uptrend will remain relevant. However, in recent weeks the market has accounted only for factors positive to the dollar and ignored all others.
The arrangement of the red and blue indicator lines points to an approximate parity between bulls and bears. During the last reporting week, longs in the "Non-commercial" group rose by 17,500, while short positions rose by 28,400. Accordingly, the net position for the week decreased by 10,900 contracts.
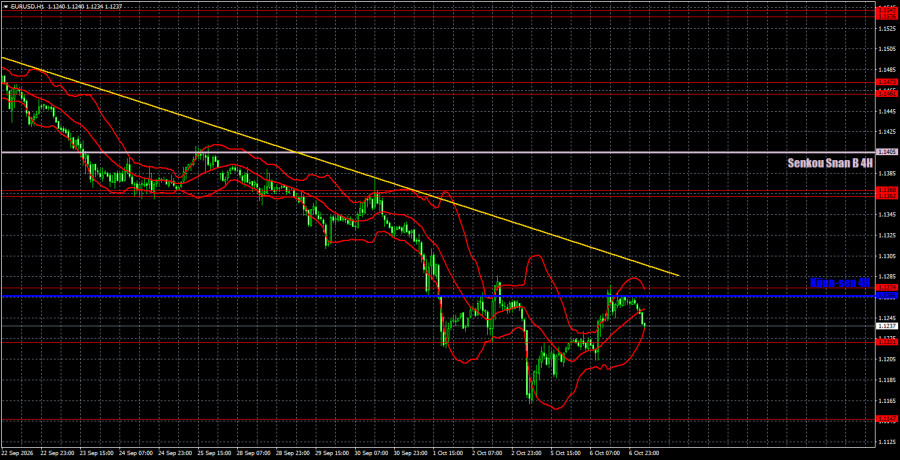
On the hourly timeframe, EUR/USD continues to form a downward trend. The Federal Reserve strongly aided the southbound trend, but that factor is unlikely to be the true reason for the dollar's strength at present. The European Central Bank should have supported the euro, having raised rates twice in 2026, and Friday's US data should have provoked a dollar collapse. But the market now sees no factors supporting the euro. Thus, the dollar continues forming a strong trend that now depends only on market sentiment.
For October 7 we highlight the following trading levels — 1.1092, 1.1147, 1.1221, 1.1274, 1.1362–1.1368, 1.1461–1.1473, 1.1536–1.1542, 1.1585, 1.1657–1.1665, and also the Senkou Span B line (1.1405) and Kijun-sen (1.1266). The Ichimoku indicator lines may shift during the day, so account for this when determining trading signals. Don't forget to move the Stop Loss to breakeven if the price has moved 15 pips in the correct direction. This will protect against possible losses if the signal proves false.
On Wednesday, no important releases are scheduled in the Eurozone, Germany, or the US. One could loosely note the Fed minutes, but that is largely a formality — minutes are published three weeks after the meeting and lose much of their topicality by then.
Traders can consider targets for short positions near 1.1221 and 1.1147, since two sell signals formed yesterday in the 1.1271–1.1274 area. If the trendline is breached, consider targets for long positions: 1.1362–1.1368 and 1.1405.

RYCHLÉ ODKAZY



















 Kontaktujte nás