Akcie na Wall Street skončily ve čtvrtek smíšeně, když je zvedly společnosti Eli Lilly (NYSE:LLY) a Apple (NASDAQ:AAPL), protože investoři zvažovali pokrok v obchodních jednáních USA s Japonskem a obavy z výhledu úrokových sazeb.
Obchodníci se po středečním prudkém výprodeji přiklonili k optimismu po komentářích amerického prezidenta Donalda Trumpa o „velkém pokroku“ v bilaterálních rozhovorech.
Trump také novinářům řekl, že očekává uzavření obchodní dohody s Čínou, ačkoli nenabídl žádné náznaky, jak by se rozhovory mohly rozběhnout, když jsou obě velmoci ve zjevné slepé uličce.
Index S&P 500 v závěrečných minutách seance snížil zisky a Nasdaq se dostal do záporných hodnot, což naznačuje, že obchodníci byli během třídenního víkendu, kdy je trh uzavřen kvůli svátku Velkého pátku, opatrní při vlastnictví amerických akcií.
Společnost Eli Lilly vzrostla o 14 % poté, co výrobce léků uvedl, že jeho experimentální pilulka fungovala stejně dobře jako hit Ozempic při snižování hmotnosti a hladiny cukru v krvi ve studii s pacienty s cukrovkou.
Společnost Apple vzrostla o 1,4 %, přičemž iPhone se vzpamatoval z některých nedávných hlubokých ztrát.
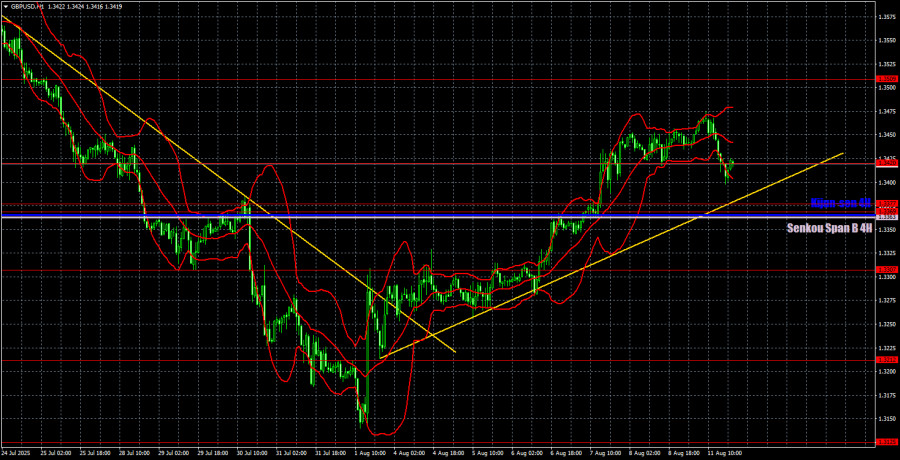
On Monday, the GBP/USD currency pair slightly declined toward the new ascending trendline, which in no way disrupted the current trend. Indeed, few expected the US currency to strengthen on Monday, but even the dollar cannot fall every day — although it has plenty of fundamental reasons to do so. Therefore, in the medium term, we expect the GBP/USD pair to continue moving north.
There was no macroeconomic background or fundamental events yesterday. However, today the US inflation report will be released. The Consumer Price Index is likely to continue rising, but according to many experts, this is just the beginning of a new, significant acceleration of price growth in the US. Thus, Donald Trump's tariffs are affecting prices in the US, contrary to the opinion of the "dove" proteges of the US president within the Federal Reserve. They have not yet had enough time to fully manifest, as Jerome Powell had warned.
As long as the price remains above the trendline and the Ichimoku indicator lines, we believe the upward trend remains intact.
On the 5-minute timeframe on Monday, only one trading signal was formed. During the US trading session, the price broke above the 1.3420 level, but this was already at the end of the intraday movement. This signal could have been traded, but it did not yield any profit.

COT reports on the British pound show that in recent years, the sentiment of commercial traders has been constantly changing. The red and blue lines representing net positions of commercial and non-commercial traders frequently cross and, in most cases, remain close to the zero mark. Right now, they have converged again, indicating an approximately equal number of buy and sell positions.
The dollar continues to fall due to Donald Trump's policies, so in principle, the demand of market makers for the pound is not particularly important at this point. The trade war will continue in one form or another for a long time, and demand for the dollar will keep falling. According to the latest report on the British pound, the "Non-commercial" group closed 22,100 BUY contracts and 900 SELL contracts. As a result, the net position of non-commercial traders decreased by 21,200 contracts over the reporting week.
In 2025, the pound experienced a sharp rise, primarily due to Trump's policies. Once this factor is removed, the dollar may resume growth, but no one knows when that will happen. It doesn't matter how quickly the net position in the pound is rising or falling — in the dollar, it is falling in any case, and usually at a faster pace.

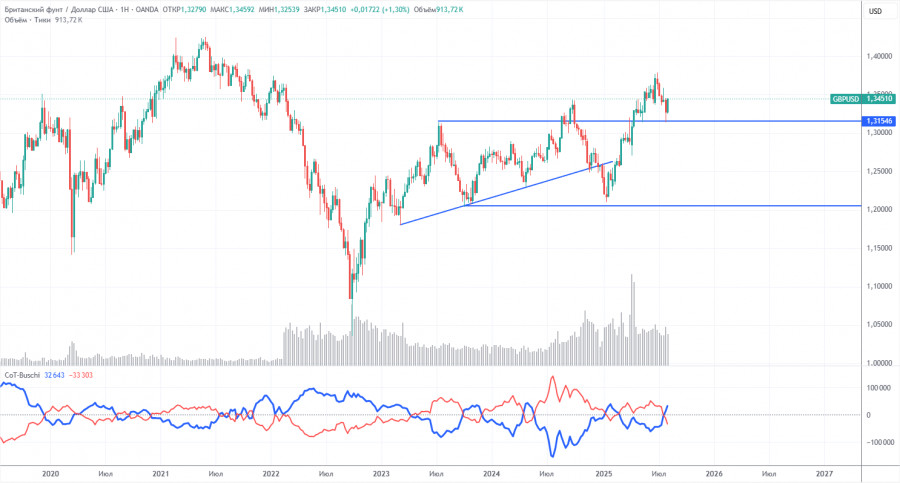
On the hourly timeframe, the GBP/USD pair continues to form an upward trend, while on the daily TF, it has rebounded from the important and strong Senkou Span B line. From our perspective, the fundamental background still does not favor the US currency, so in the long term, we expect the continuation of the "2025 trend." Recent news and events collectively point to a further decline in the US currency.
For August 12, we highlight the following important levels: 1.3125, 1.3212, 1.3369–1.3377, 1.3420, 1.3509, 1.3615, 1.3681, 1.3763, 1.3833, 1.3886. The Senkou Span B line (1.3363) and the Kijun-sen line (1.3367) can also serve as signal sources. We recommend setting the Stop Loss to breakeven when the price moves 20 pips in the right direction. The Ichimoku indicator lines may shift during the day, which should be taken into account when identifying trading signals.
On Tuesday, the UK will release fairly interesting and important reports on unemployment, changes in the number of unemployed, and wages. In the US, the equally important July inflation report will be published. Thus, volatility may be quite high during the day.
We believe the British pound may resume growth on Tuesday. Long positions can be opened on a rebound from the 1.3369–1.3377 area, from the Kijun-sen and Senkou Span B lines. A consolidation above the 1.3420 level can also be used. Short positions, however, are advisable only after breaking below the trendline and the Ichimoku indicator lines, with the downside target at 1.3307.