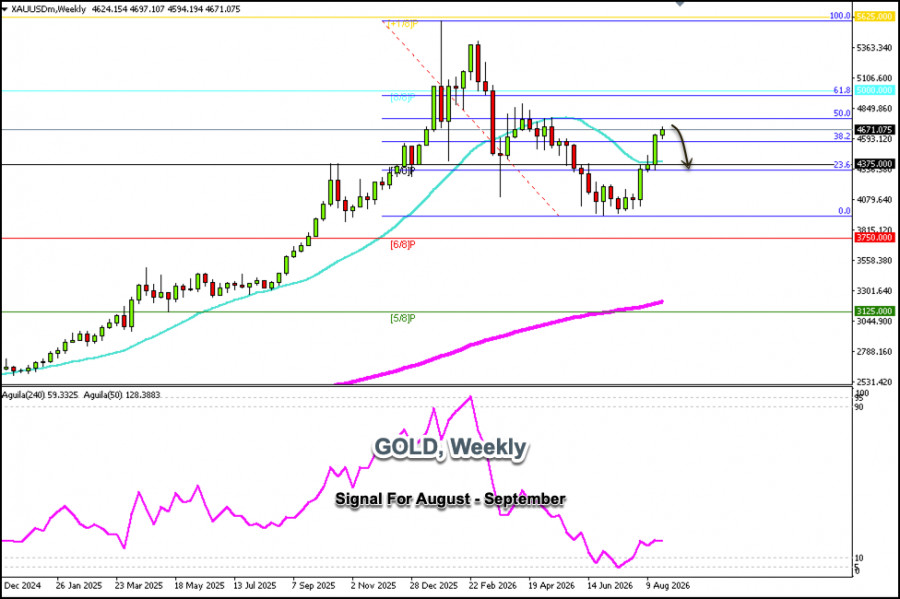
The weekly chart for gold shows that it has upside potential and, over the past four consecutive weeks, has been rising, gaining approximately $600, from $4,030 to its current high.
From a technical perspective, we expect a correction in the coming days toward the 21-day simple moving average (SMA), which stands at $4,375.
If gold remains below $4,681 in the coming days—where there is strong daily resistance—we could look for selling opportunities with targets at the 38.2% Fibonacci level, around $4,593. Finally, we expect strong support around the 23.6% Fibonacci level, which also coincides with the Murray 7/8 level, around $4,375.
On the upside, according to the weekly chart, gold is likely to reach the psychological level of $5,000, which also coincides with the 61.8% Fibonacci level.
Therefore, we believe this could be a good point to continue buying after a technical correction. However, we must keep in mind that gold has been in an uptrend for a month and that a strong technical correction is more likely to occur in the coming days.
Our trading plan for the coming days will be to sell below $4,690, with targets at $4,590, $4,490, and $4,375.

QUICK LINKS



















 Contact Us