The EUR/USD currency pair experienced fluctuations on Tuesday, moving both up and down. As we warned, volatility throughout the day was quite high, though not as extreme as it could have been. Traders largely overlooked the morning reports from the Eurozone, even though they could have triggered a drop in the European currency, as the business activity indices came in weaker than expected. The market was primarily focused on the forthcoming Non-Farm Payroll and unemployment reports from the US. Once these reports were released, the market seemed uncertain about how to react.
To recap, the unemployment rate rose to 4.6% in November, above expectations. At the same time, the Non-Farm Payroll figure for November exceeded forecasts, increasing by 60,000 jobs, but this cannot be considered a strong result. Additionally, the October report showed a reduction of 105,000 jobs, while the September figure was revised upwards to 108,000. Overall, we consider the US labor market report weak, which naturally led to the dollar's decline after the data were published. The subsequent decrease could be viewed as another technical correction. However, it is notable that the upper boundary of the sideways channel at 1.1400-1.1830 was tested, which could provoke a new extended decline on technical grounds.
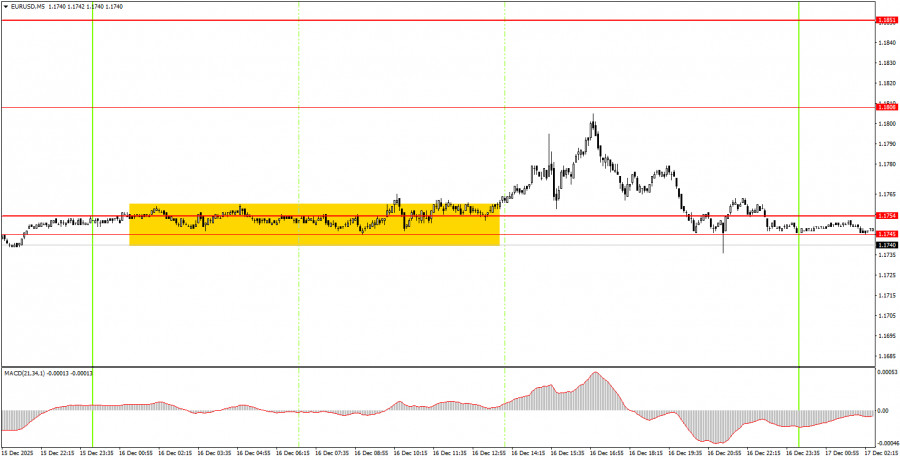
On the 5-minute timeframe on Tuesday, only one trading signal was formed. Throughout the European session, the price attempted to break away from the 1.1745-1.1754 area, and during the US session, it managed to do so. A rise began, and the price nearly reached the nearby target level of 1.1808. From that level, the pair returned to its previous positions by the end of the day.
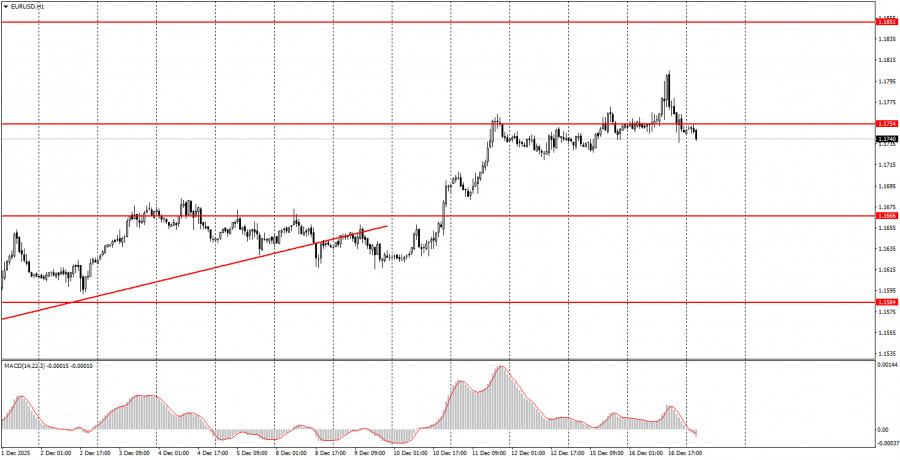
On the hourly timeframe, the EUR/USD pair continues to form an upward trend, though the price exceeded the trendline last week. The overall fundamental and macroeconomic backdrop remains very weak for the US dollar, so we expect further growth in the pair. However, the price has reached the upper line of the 1.1400-1.1830 channel, so it now needs to either overcome it or remain flat.
On Wednesday, novice traders can look to trade from the area of 1.1745-1.1754 once again. A price consolidation below this area will allow for short positions targeting 1.1655-1.1666. A breakout above this area will signal a long position targeting 1.1808.
On the 5-minute timeframe, key levels to consider include 1.1354-1.1363, 1.1413, 1.1455-1.1474, 1.1527-1.1531, 1.1550, 1.1584-1.1591, 1.1655-1.1666, 1.1745-1.1754, 1.1808, 1.1851, 1.1908, and 1.1970-1.1988. On Wednesday, a second estimate of November inflation for the Eurozone is scheduled for release, a secondary indicator. The US calendar is empty today. Therefore, volatility is likely to decline.
Important Note: Significant speeches and reports (always included in the news calendar) can greatly influence the movement of the currency pair. Therefore, during their release, it is advisable to trade cautiously or exit the market to avoid sharp reversals against the preceding movement.
Remember: For beginners trading in the Forex market, it is important to understand that not every trade can be profitable. Developing a clear strategy and practicing money management are keys to long-term trading success.

SZYBKIE LINKI


 Skontaktuj się z ForexMart