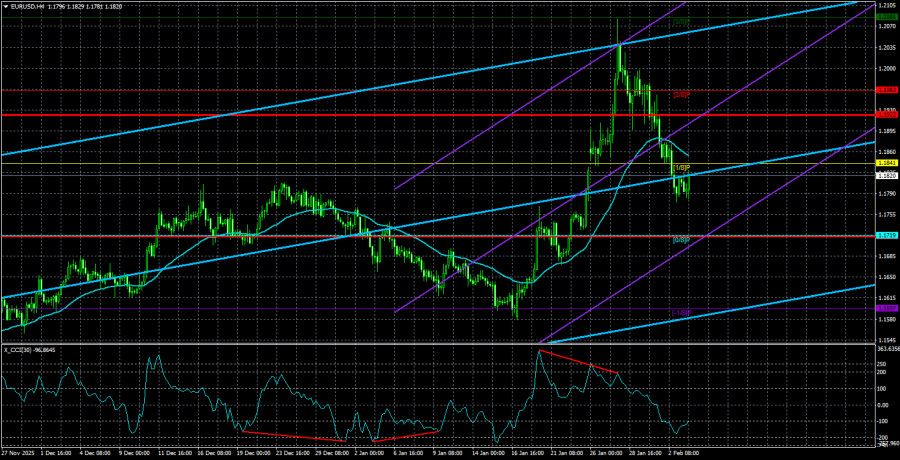
The EUR/USD currency pair remained calm and in a corrective mode on Tuesday. However, the 4-hour timeframe shows that the current decline, totaling around 300 pips, is... a correction against a 500-pip rise. Thus, the pair has corrected approximately 50.0-61.8% according to Fibonacci levels, which is considered normal. Therefore, the resumption of the growth of the European currency is expected in the near future. Recall that a key factor in the market over the past 7 months has been the euro's flat movement on the daily timeframe. This flat movement has hindered the euro's ability to move and has negatively impacted other currency pairs. As seen in the illustration below, the end of the flat period and the volatility during that time are evident. The moment the flat had concluded, volatility surged to high levels.
Since the price exited the sideways channel of 1.1400-1.1830 at its upper boundary, and the fundamental backdrop for the dollar remains the same as in 2025, we do not expect anything other than a decline in the American currency. From our perspective, these two factors are sufficient to understand where EUR/USD will move next.
Regarding the macroeconomic backdrop and its impact on market sentiment, it is currently quite sparse and indirect. Traders may react to an isolated report, but in most cases, they ignore data. Recall that the US stellar GDP report was overlooked. On Monday, the dollar reacted to the ISM Manufacturing Index, but we have to ask, what prompted this index to rise so sharply?
If you look at the index's chart over the past 10 years, it becomes clear that sharp changes are atypical and occur rather infrequently. It's one thing when the index consistently increases, then suddenly jumps by several points. Then at least the trend is understandable. It's another thing when the index has stayed below the "waterline" for nearly three years and suddenly leaps out of the "red zone," showing a growth of nearly 5 points.
Let's not forget that a few months ago, Donald Trump replaced the head of the Bureau of Statistics, and since then, many indicators have shown rather contradictory values. For example, US inflation is not rising, even though many consumers report significant price increases in stores and services. Real estate prices are rising, rents are increasing, yet inflation remains stagnant. Although the Bureau of Statistics does not publish the ISM index, doubts still linger...
The GDP growth rate is a separate story. Current data in the US demonstrate well that even official statistics cannot always be trusted, as they may reflect data that are not what one might expect. GDP is growing not because the country is developing, unemployment is falling, wages are rising, and investments are increasing; it is growing artificially. This is due to government spending, reductions in imports, and trade tariffs.
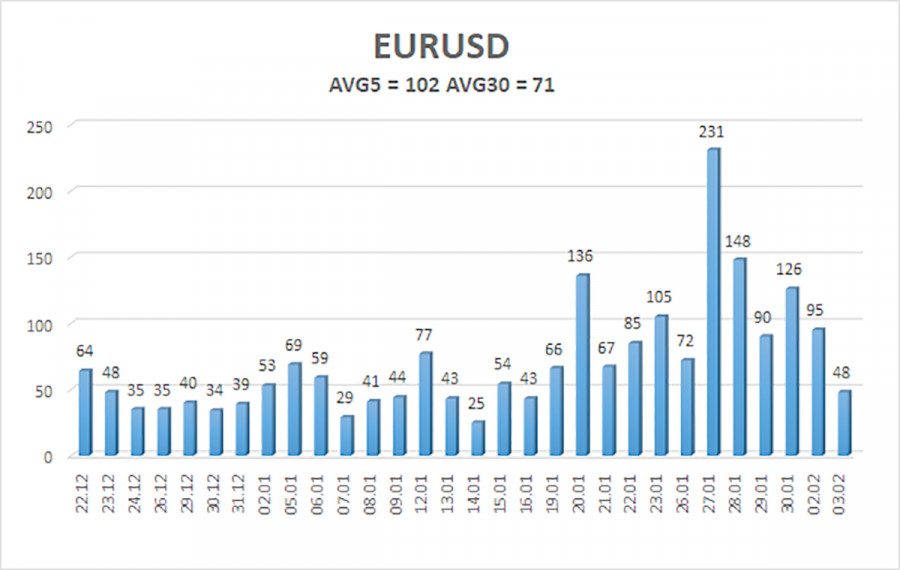
The average volatility of the EUR/USD pair over the last five trading days as of February 4 is 102 pips, which is characterized as "average." We expect movement between 1.1719 and 1.1922 on Wednesday. The upper linear regression channel is pointing upward, indicating further growth in the euro. The CCI indicator has entered the overbought zone and formed two "bearish" divergences, signaling an impending pullback. Note how volatility increased as soon as the pair exited the sideways channel of 1.1400-1.1830.
S1 – 1.1719
S2 – 1.1597
S3 – 1.1475
R1 – 1.1841
R2 – 1.1963
R3 – 1.2085
The EUR/USD pair is continuing a fairly strong correction within an upward trend. The global fundamental background remains extremely negative for the dollar. The pair has spent seven months in a sideways channel, and it seems that the time has come to resume the global trend of 2025. There is no fundamental basis for the dollar's long-term growth. When the price is below the moving average, small short positions may be considered targeting 1.1719 on purely technical grounds. Above the moving average, long positions remain relevant with targets of 1.1963 and 1.2085.
LINKS RÁPIDOS


 Contate-nos