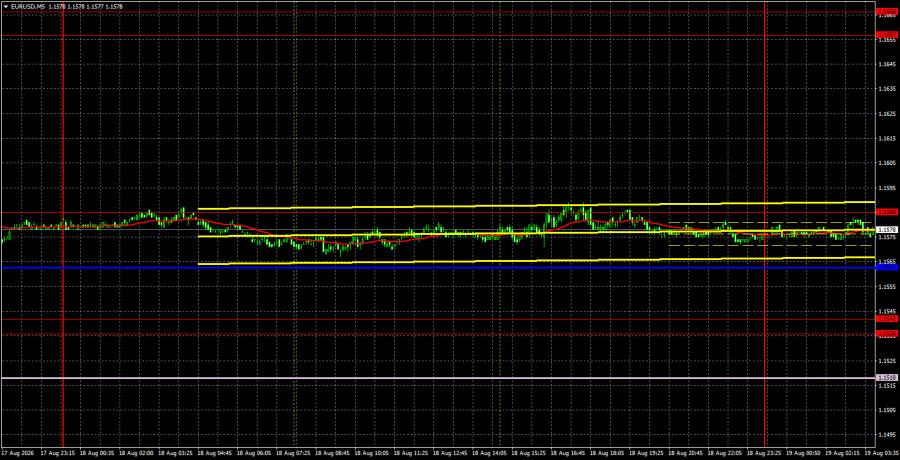
The EUR/USD currency pair traded with a volatility of about 20 pips on Tuesday. We previously described volatility of around 40 pips as "low," so 20 pips indicates a lack of movement. Thus, despite the relatively large number of macroeconomic events, the market found nothing particularly interesting in them, as we had warned. Reports on economic activity or new home sales are currently not significant to the market. These reports rarely provoke a market reaction, even in normal times. Right now, all the market's attention is focused on the most important events and publications, such as central bank meetings or NonFarm Payrolls. However, there is good news: the euro is not falling. We note that we expect further upward movement regardless of the fundamental and macroeconomic backdrop. The fact that the euro is not declining encourages us. Even if the market refuses to move at this time, the euro maintains a leading position, suggesting it could return to this year's highs.
From a technical standpoint, the pair has left the sideways channel at 1.1362-1.1461 after a month of "struggling" and is now in an upward trend. The trend is weak and slow, but it is worth recalling that none of the global factors favor the U.S. currency at the moment. Only geopolitics can help it, specifically some significant event, not just the latest exchanges of pleasantries and threats between Iran and the U.S.
On the 5-minute timeframe, no trading signals were formed on Tuesday, as the pair moved purely sideways throughout the day. Formally, the price bounced off 1.1585 during the American trading session, but a critical line lay 20 pips below it, so short positions should not have been initiated under any circumstances.
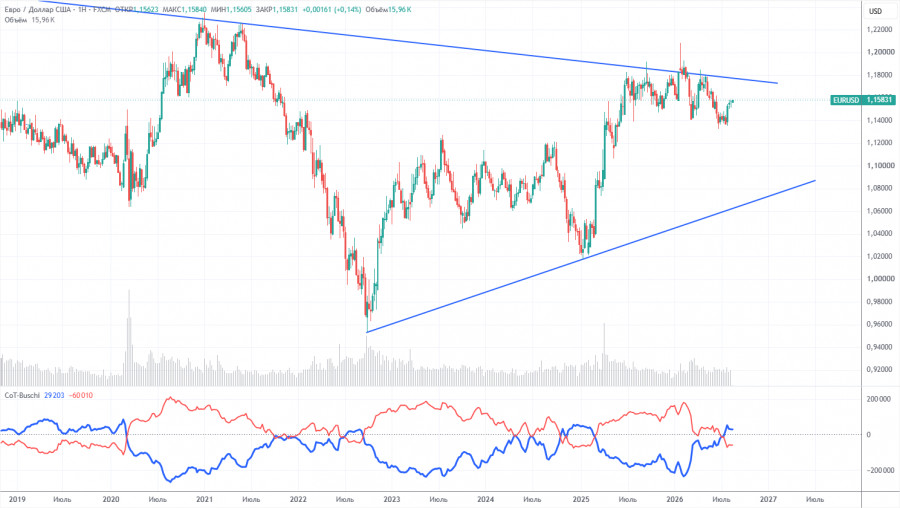
The latest COT report is dated August 11. In the weekly timeframe illustration, it is clear that the net position of non-commercial traders has become "bearish" and has significantly decreased in 2026 due to geopolitical events. Traders have been shedding European currency in favor of the U.S. dollar in recent months. Donald Trump's policy has not changed, but the dollar has served for some time as a "reserve currency."
We still do not see any fundamental factors for strengthening the European currency, while there are still sufficient factors for the American dollar to decline. The war in the Middle East temporarily made the dollar super attractive, but when this factor reaches its "expiry date," everything will return to normal. This process may have already concluded. In the long term, the euro could fall to the level of $1.08 (the trend line), but the upward trend will still remain relevant. Over the past months of dollar strength, the pair has not approached this line significantly.
The positioning of the red and blue lines of the indicator indicates parity between bulls and bears. During the last reporting week, the number of long positions in the "Non-commercial" group decreased by 4,600, while the number of short positions decreased by 2,700. Accordingly, the net position decreased by 1,900 contracts over the week.
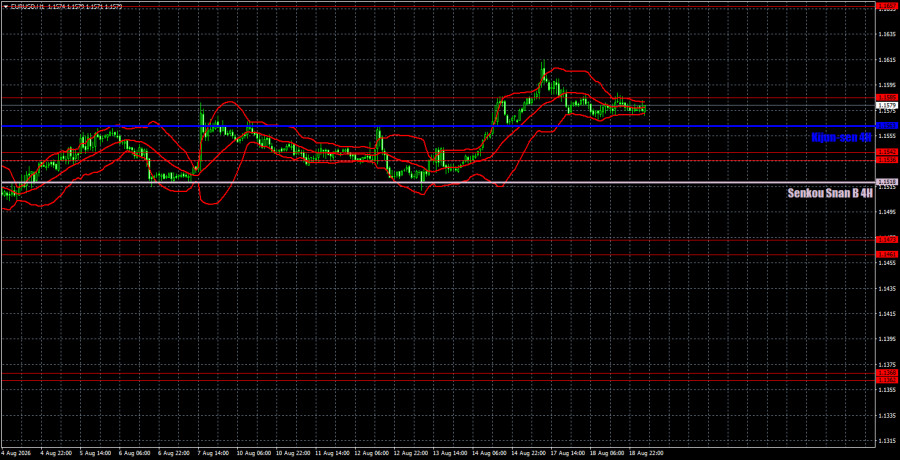
On the hourly timeframe, the pair maintains an upward trend. The situation in the Middle East remains tense and has not improved, but this is not sufficient for a new, powerful rise of the dollar. Over the past few months, the market has ignored all positive factors for the euro and has focused solely on the Federal Reserve's monetary policy, placing inflated demands on it. Currently, the European currency has every chance for medium-term growth, while the dollar can only expect technical corrections and geopolitical influences.
For August 19, we identify the following levels for trading: 1.1234, 1.1274, 1.1362-1.1368, 1.1461-1.1473, 1.1536-1.1542, 1.1585, 1.1657-1.1666, 1.1750-1.1760, 1.1786, 1.1830-1.1837, as well as the Senkou Span B line (1.1518) and the Kijun-sen line (1.1563). The Ichimoku indicator lines may shift throughout the day, which should be taken into account when determining trading signals. Don't forget to set stop-loss orders to break even if the price moves in the correct direction by 15 pips. This will protect against potential losses if the signal proves false.
On Wednesday, the Eurozone will hear a speech from European Central Bank President Christine Lagarde and see the publication of the second estimate of July inflation. In the U.S., the minutes from the last FOMC meeting will be released. We believe that only Lagarde may provide the market with useful information; the other events are formal and secondary.
Today, traders may consider short positions with targets at 1.1563 and 1.1536-1.1542, as the price has settled below 1.1585. A consolidation above 1.1585 will allow opening long positions targeting 1.1657-1.1666. However, volatility may be weak again.
QUICK LINKS



















 Contact Us